This electronic supplement contains a table of teleseismic earthquake information and seismograms for all observed tremor-triggering events and figures showing observations of triggered tremor, observed dynamic stress versus back azimuth, and an example of examination of triggered earthquakes in California with CrazyTremor.
Table S1 contains earthquake information for the 18 teleseismic earthquakes examined in this study and the examination results of triggered tremor in six regions in New Zealand in (1) central Hikurangi in the North Island, (2) northern Hikurangi in the North Island, (3) Northland in the North Island, (4) Kaikōura in the South Island, (5) the central Alpine fault in the South Island, and (6) Southland in the South Island.
Triggered tremor sources were observed in these regions after nine triggering earthquakes, including the 23 December 2004 Mw 8.1 earthquake offshore of the South Island (Fig. S1) and the 28 March 2005 Mw 8.6 Nias (Fig. S2), 3 May 2006 Mw 8.0 Tonga (Fig. S3a), 12 September 2007 Mw 8.5 Sumatra (Fig. S3b), 15 July 2009 Mw 7.8 Fiordland (Fig. S4a), 29 September 2009 Mw 8.1 Samoa (Fig. S4b), 27 February 2010 Mw 8.8 Chile (Fig. S5a), 11 March 2011 Mw 9.0 Tohoku (Fig. S5b), and 11 April 2012 Mw 8.6 Sumatra (Fig. S6) earthquakes.
Figure S7 shows the observed dynamic stress in six regions for Love waves (the transverse component) and Rayleigh waves (the vertical component). Figure S8 illustrates observed triggered earthquakes in California after the 2010 Mw 8.8 Chile earthquake with the CrazyTremor software.
Table S1. [plain text table; ~7 KB]. A list of 18 teleseismic earthquakes and the examination results of triggered tremor in six regions in New Zealand.
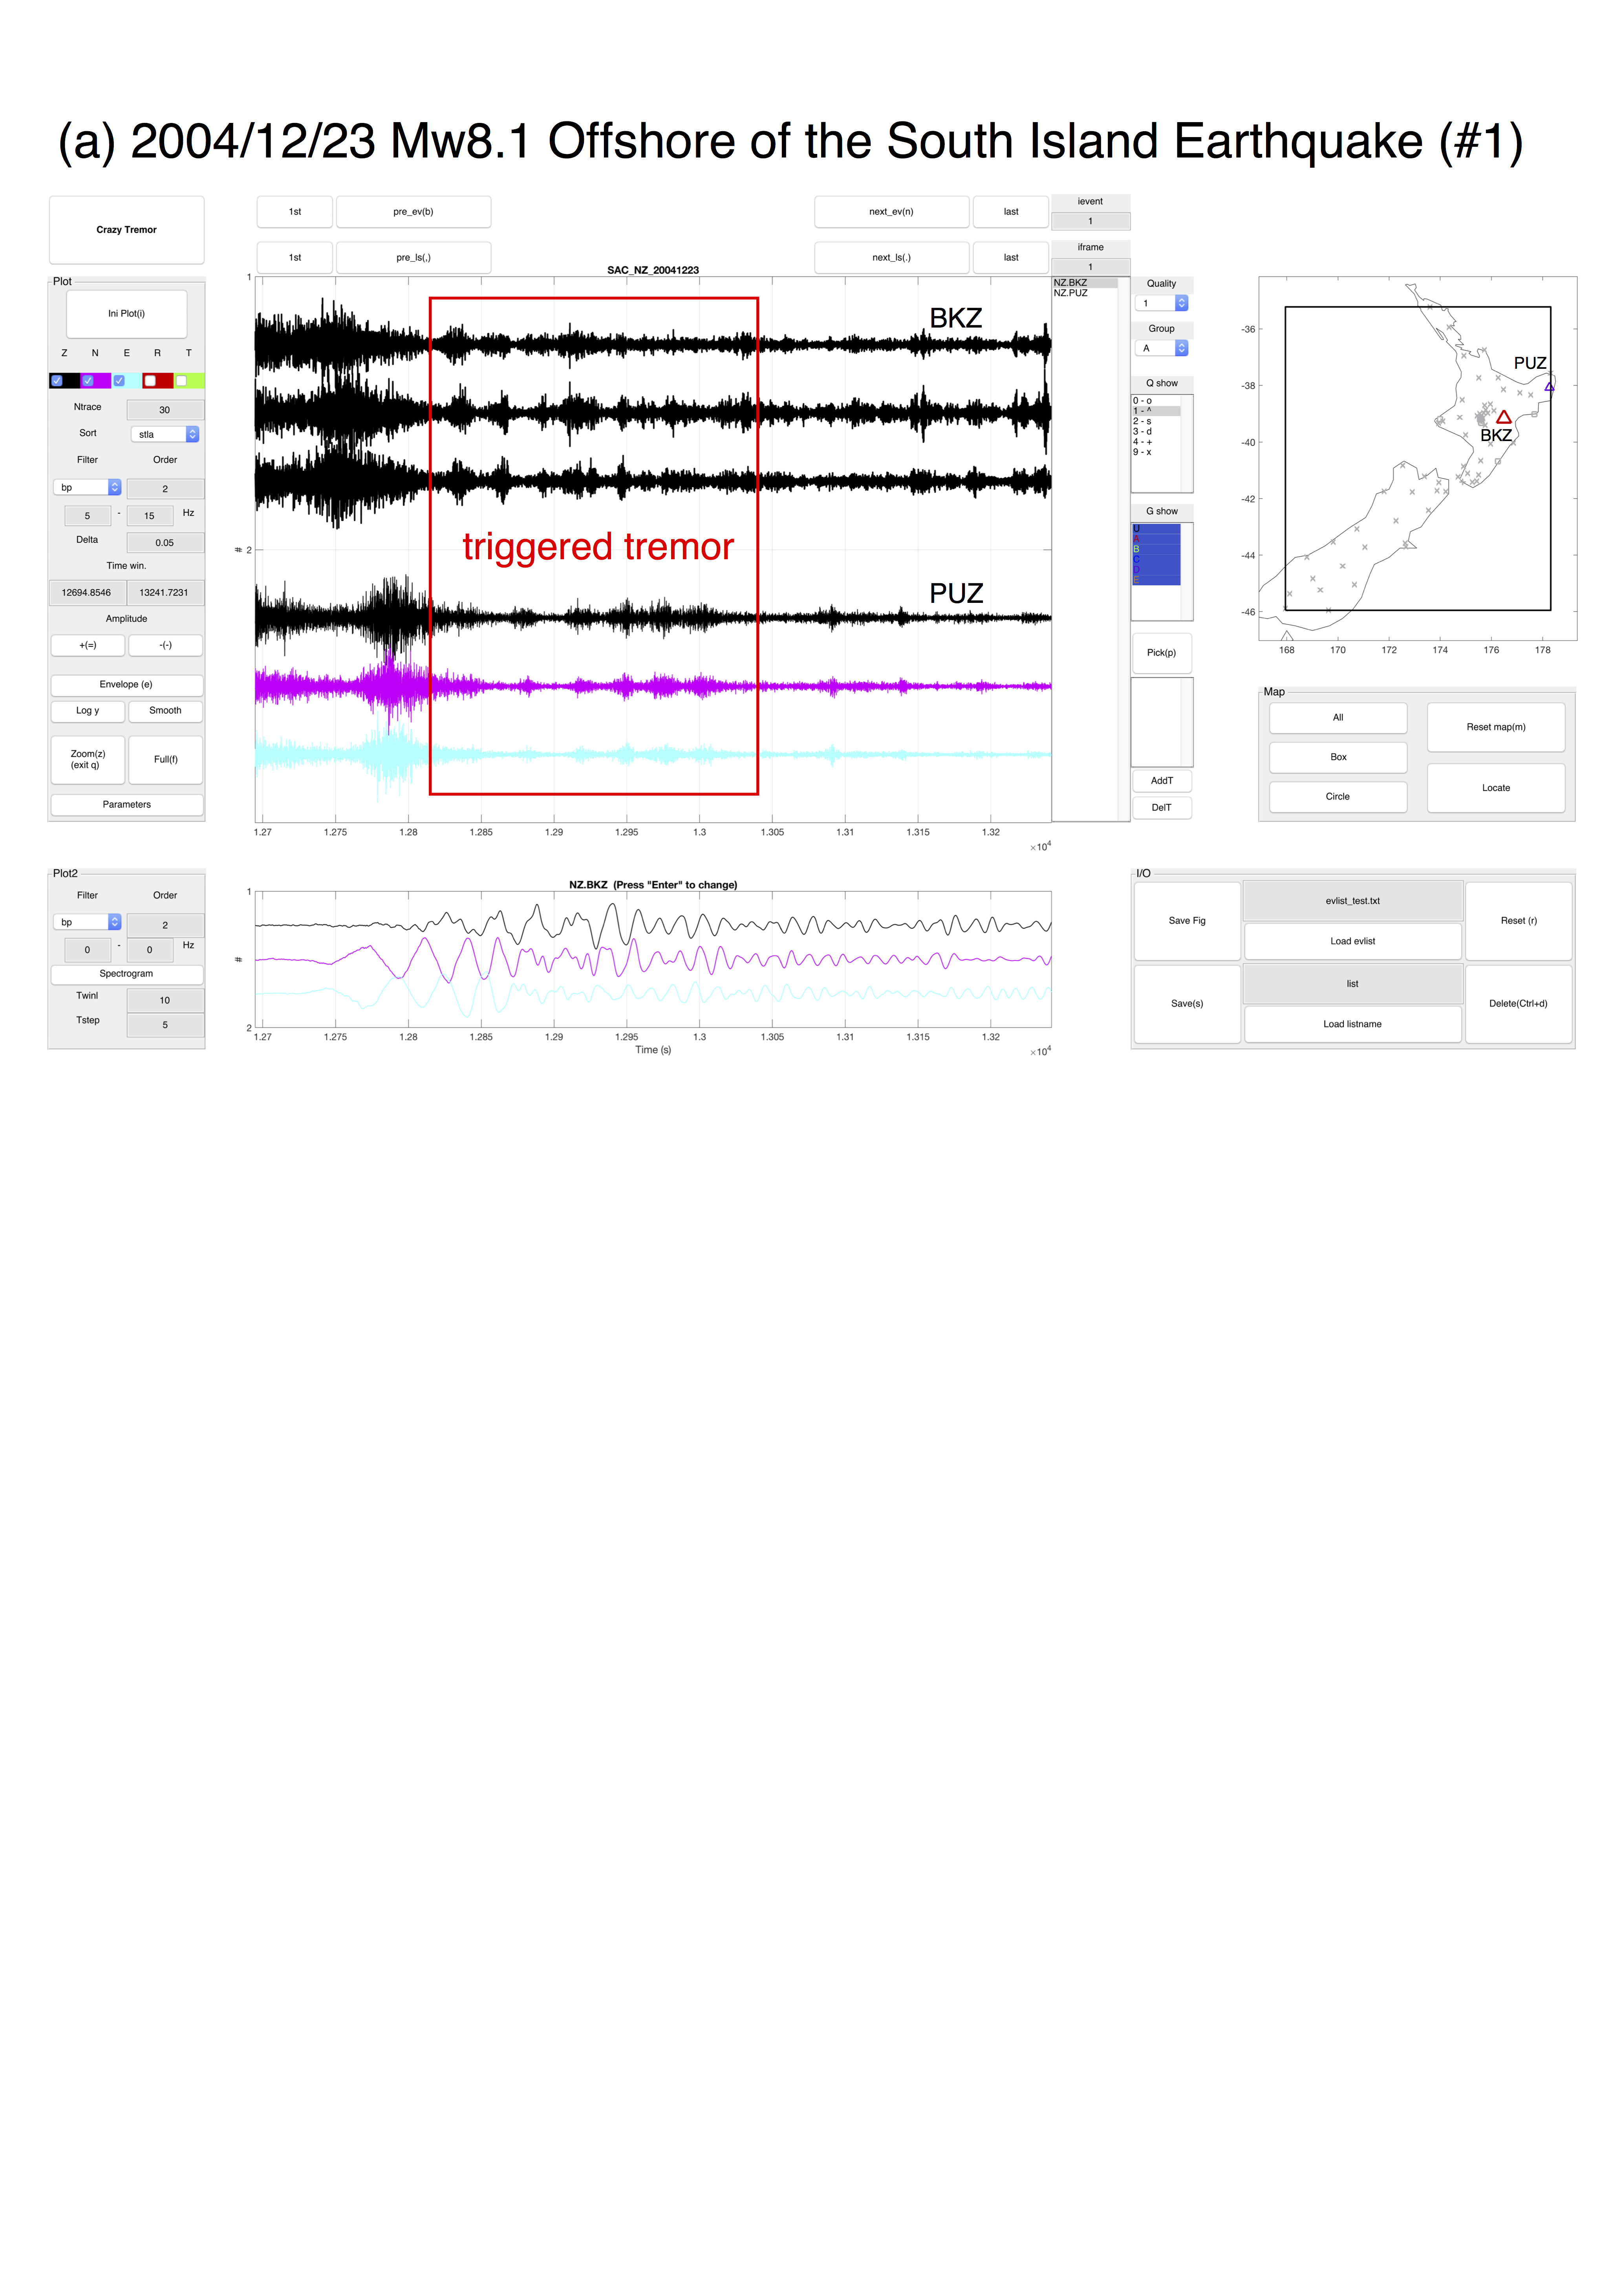
Figure S1. A snapshot of CrazyTremor showing the observations of triggered tremor after (a) the 23 December 2004 Mw 8.1 earthquake offshore of the South Island. The central window plots tremor-band seismograms, and the bottom window shows surface-waveband seismograms. The black, pink, and cyan colors represent seismograms in the vertical (Z), east–west (E), and north–south (N) components of the station, respectively. Different symbols and colors shown on the map correspond to the tagging function of “Quality” and “Group” for each station.
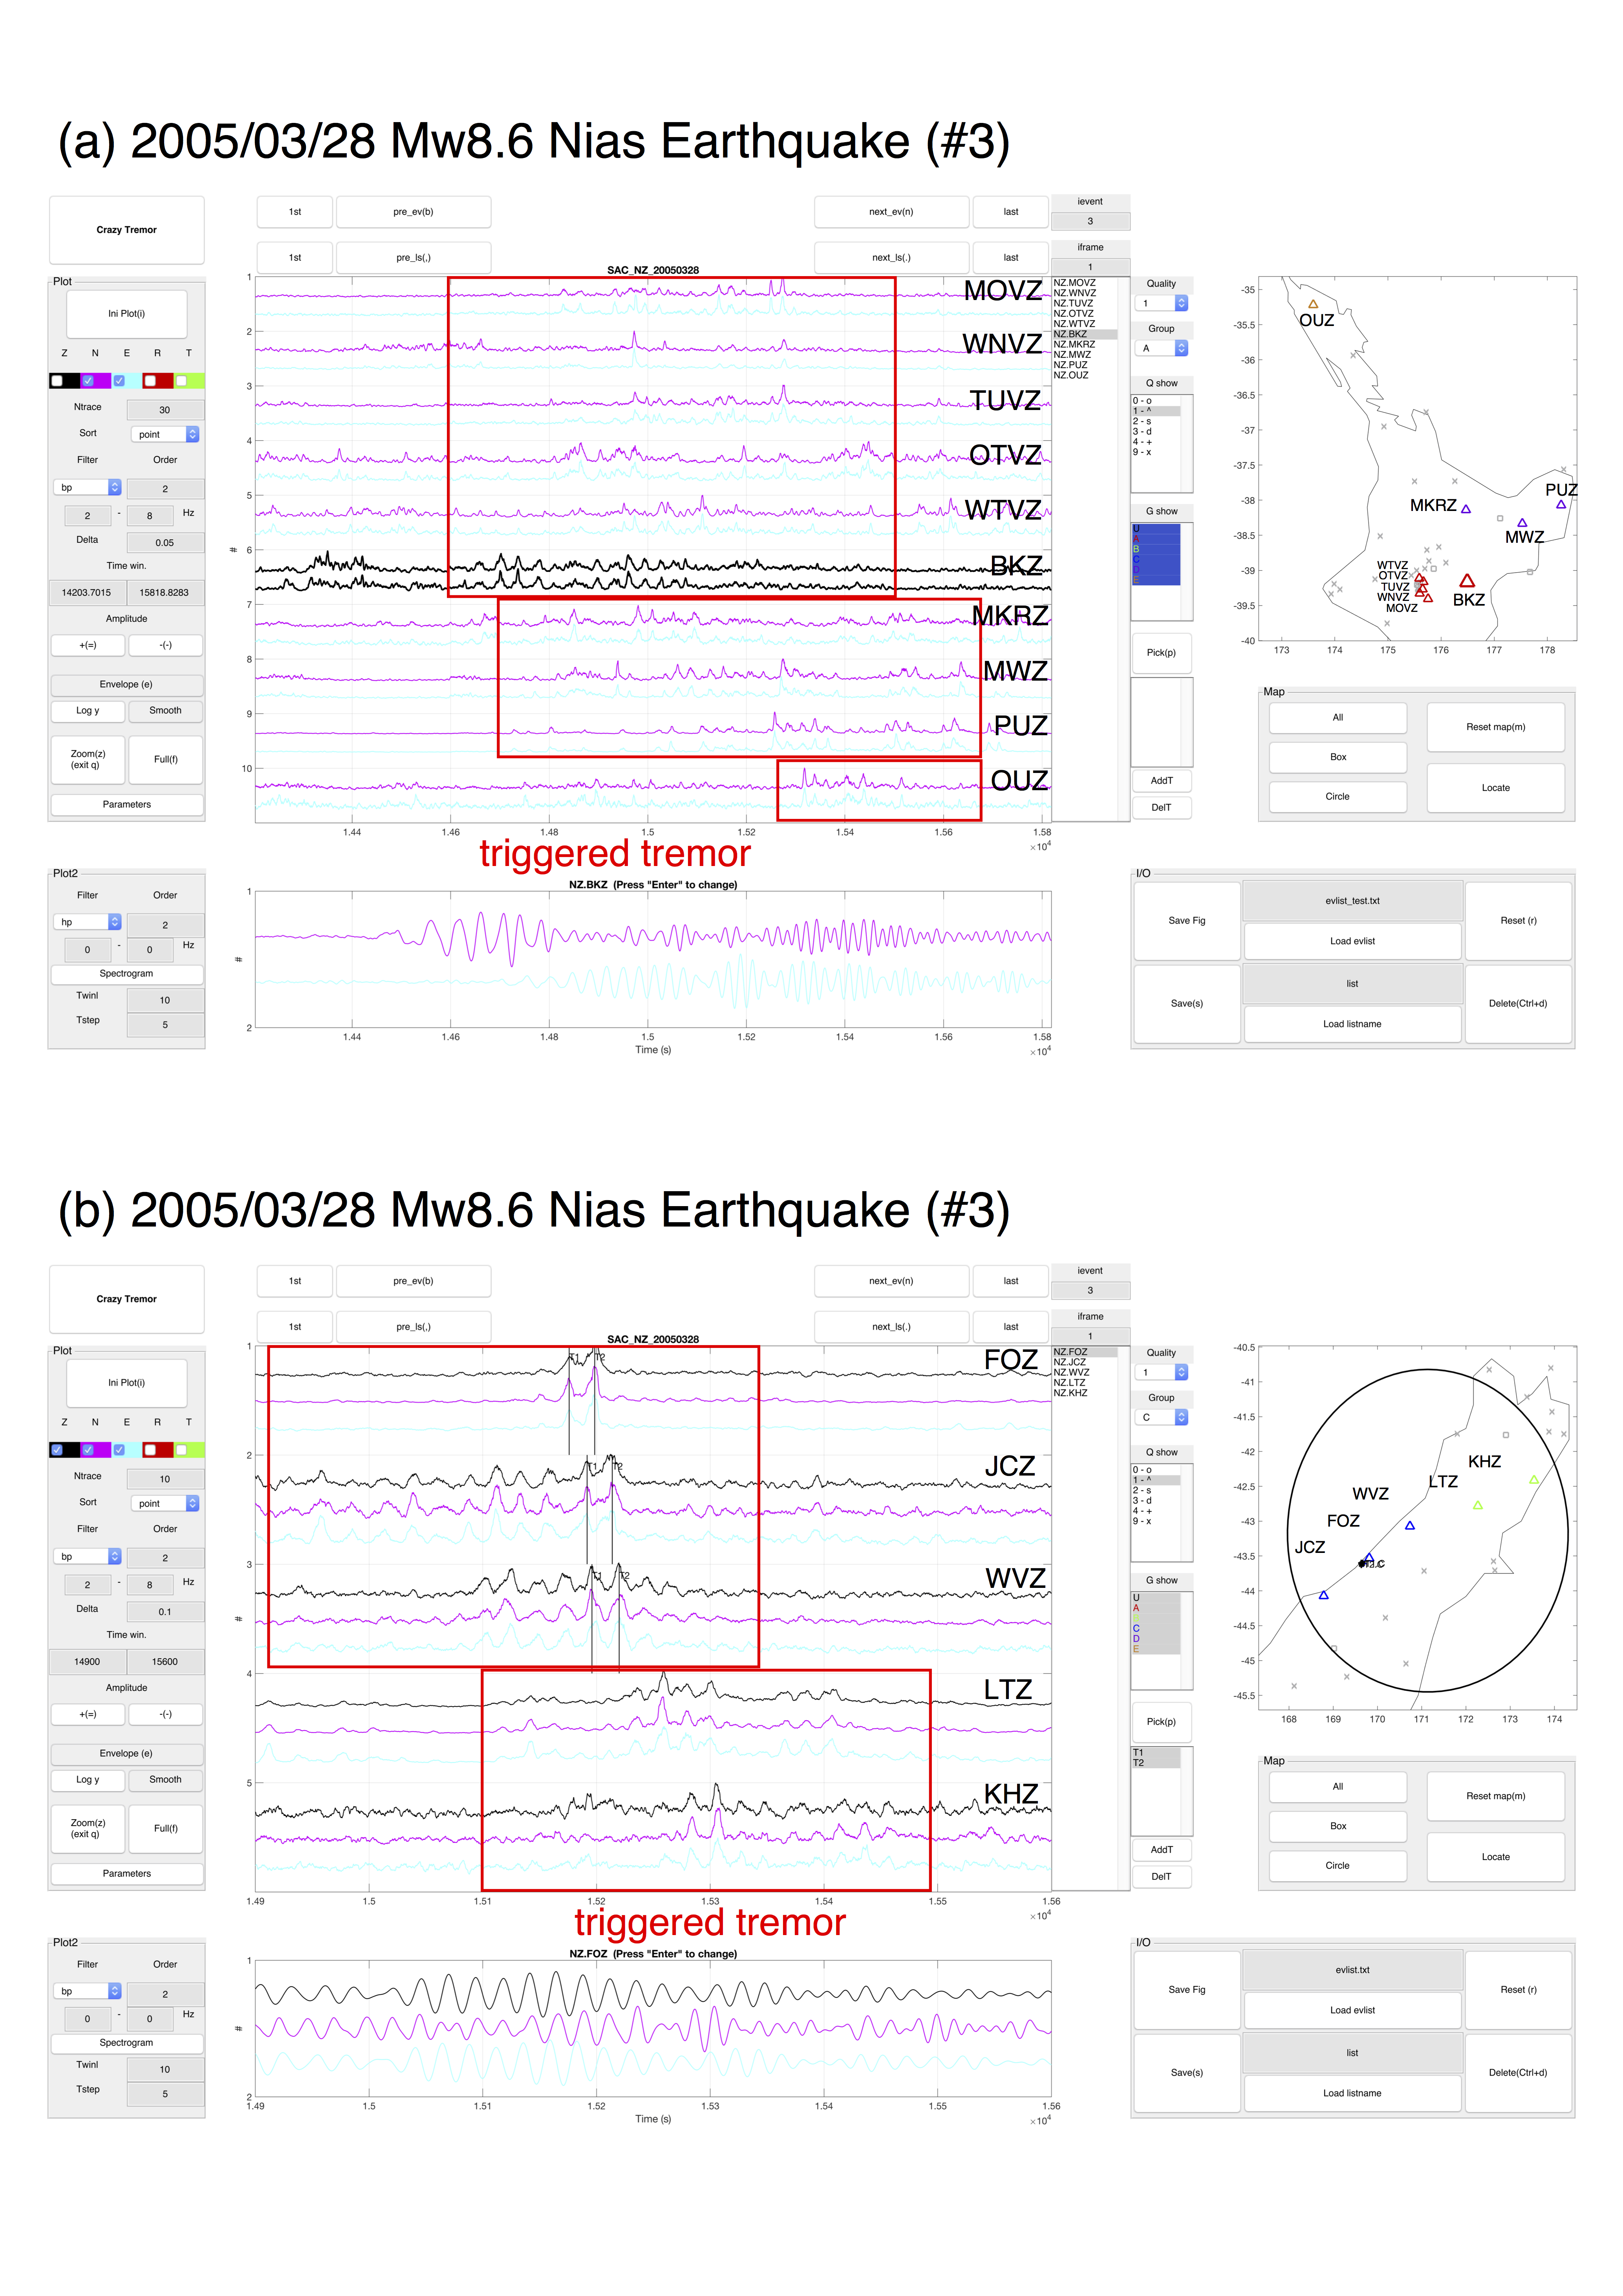
Figure S2. Observations of triggered tremor after the 28 March 2005 Mw 8.6 Nias earthquake in (a) the North Island and (b) the South Island. All notations are the same as in Figure S1.
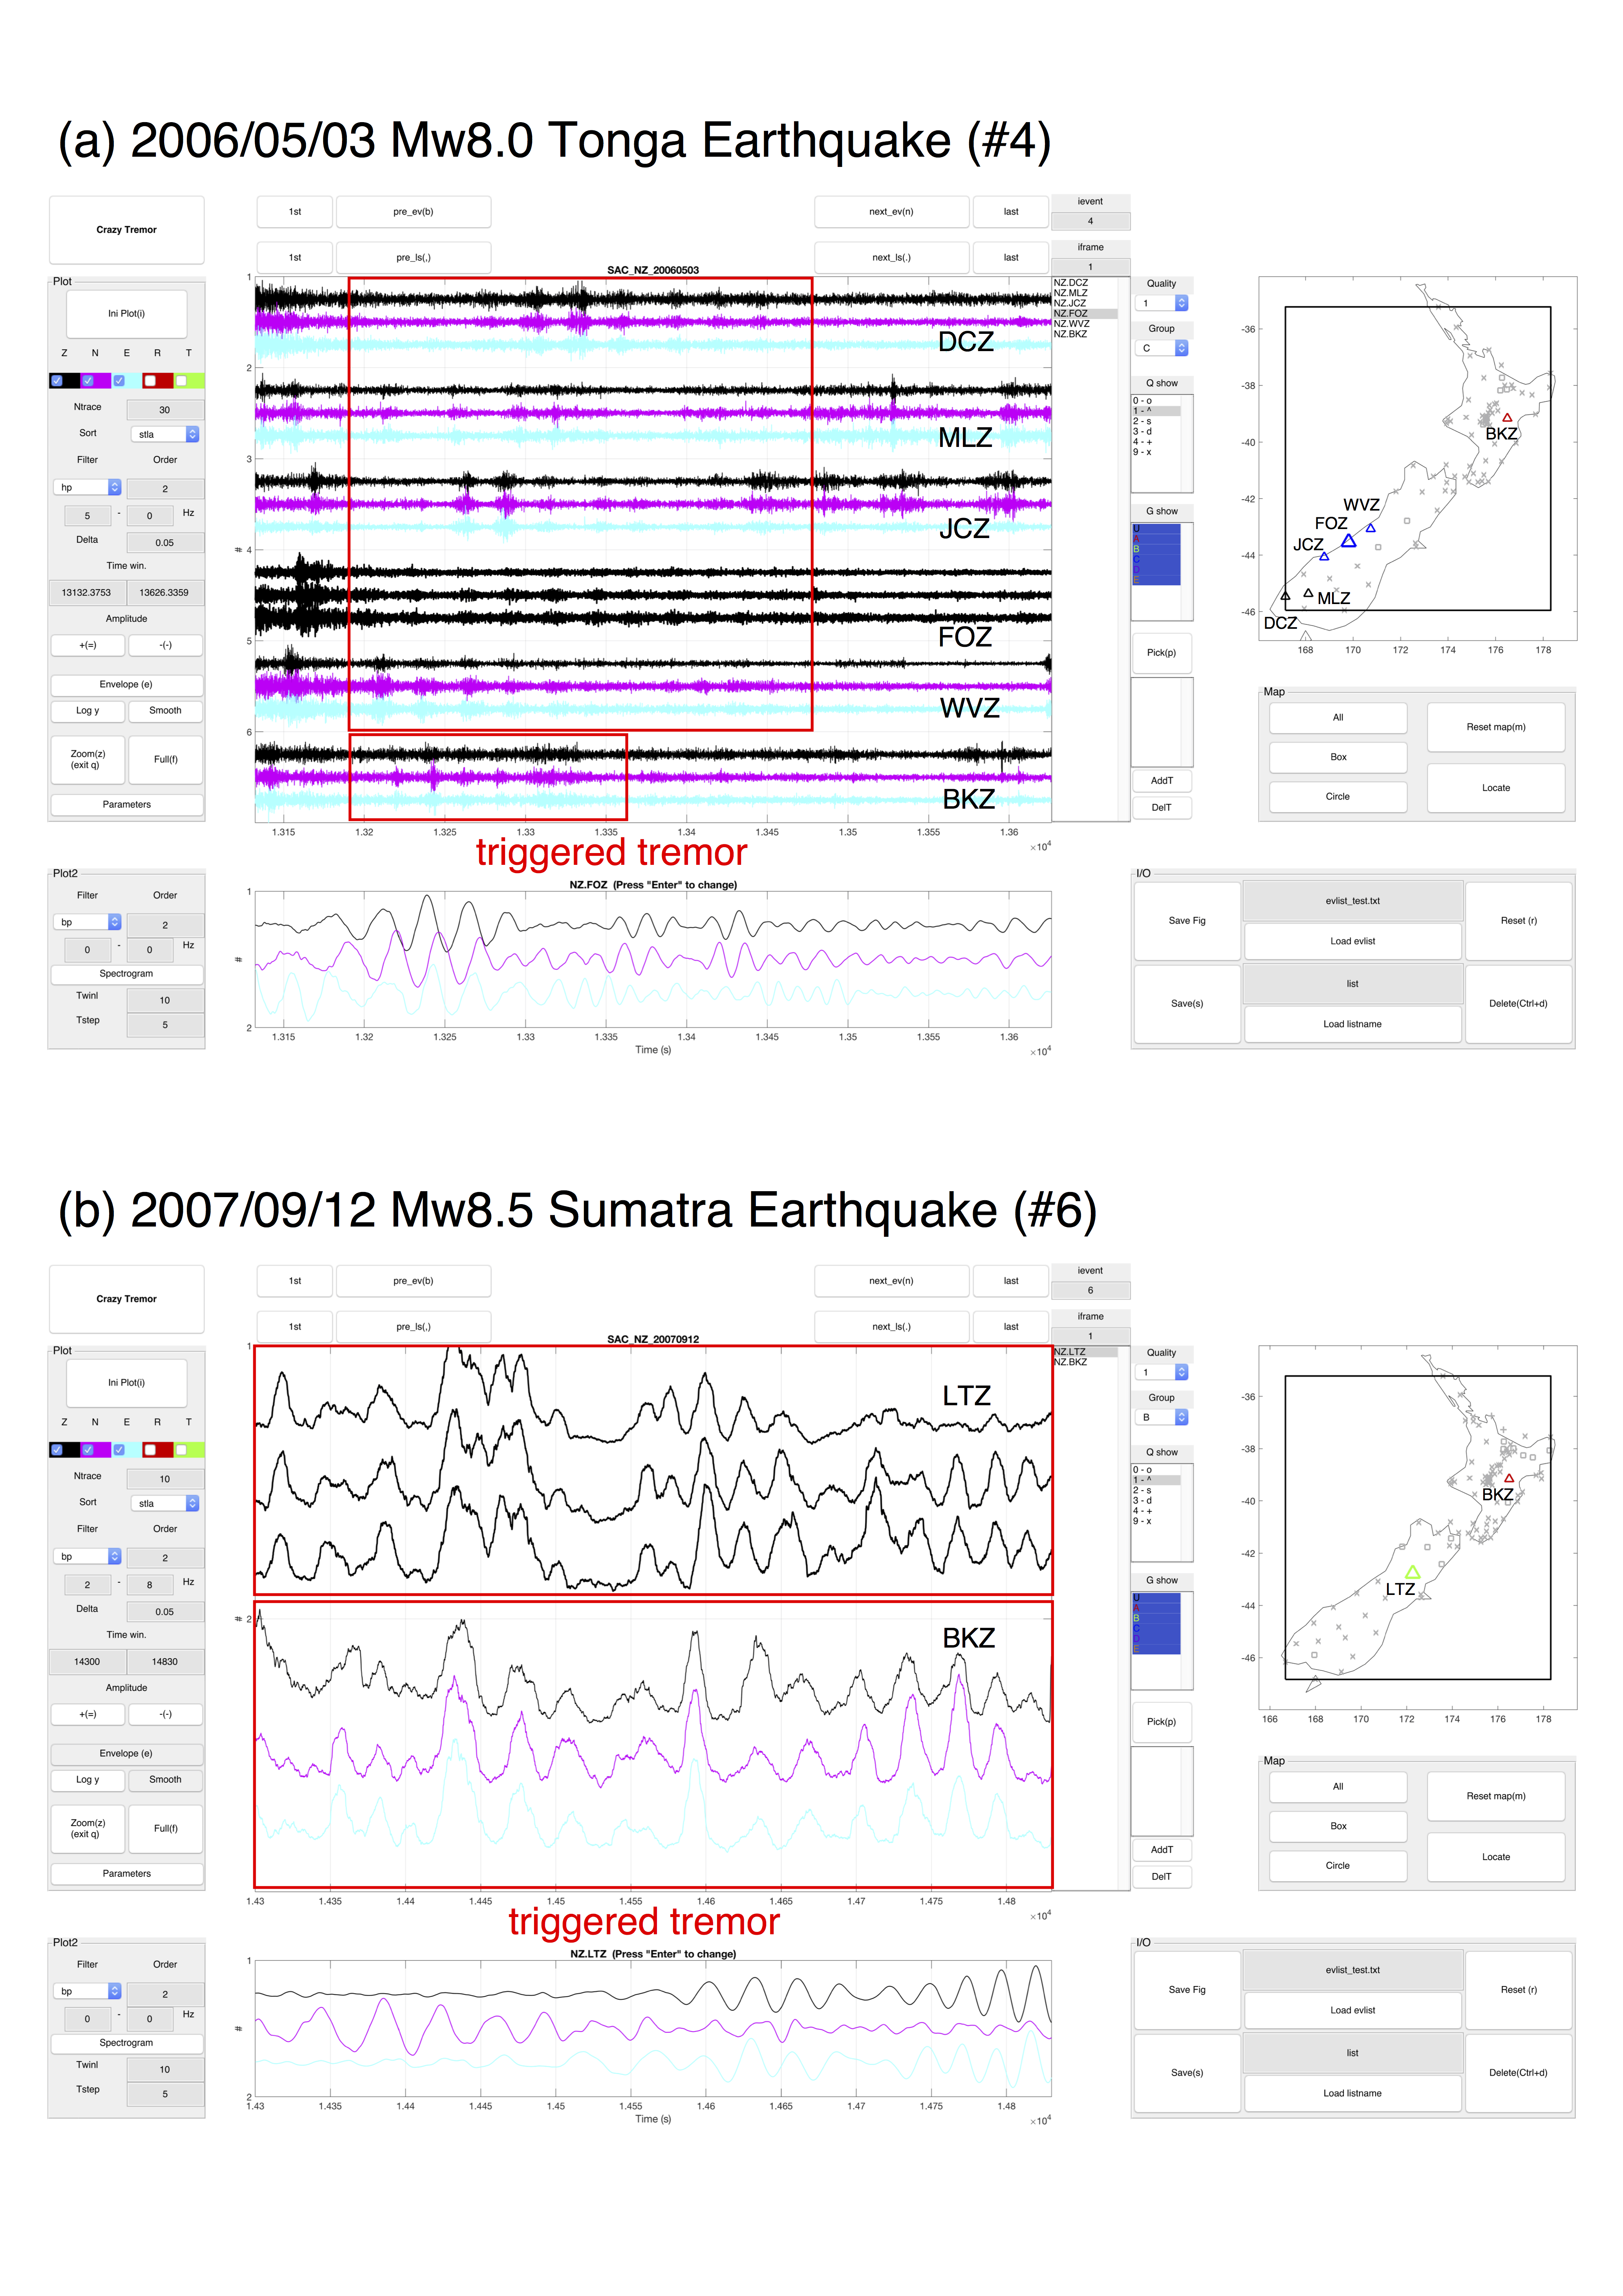
Figure S3. Observations of triggered tremor after (a) the 3 May 2006 Mw 8.0 Tonga earthquake and (b) the 12 September 2007 Mw 8.5 Sumatra earthquake. All notations are the same as in Figure S1.
Figure S4. Observations of triggered tremor after (a) the 15 July 2009 Mw 7.8 Fiordland earthquake and (b) the 29 September 2009 Mw 8.1 Samoa earthquake. All notations are the same as in Figure S1.
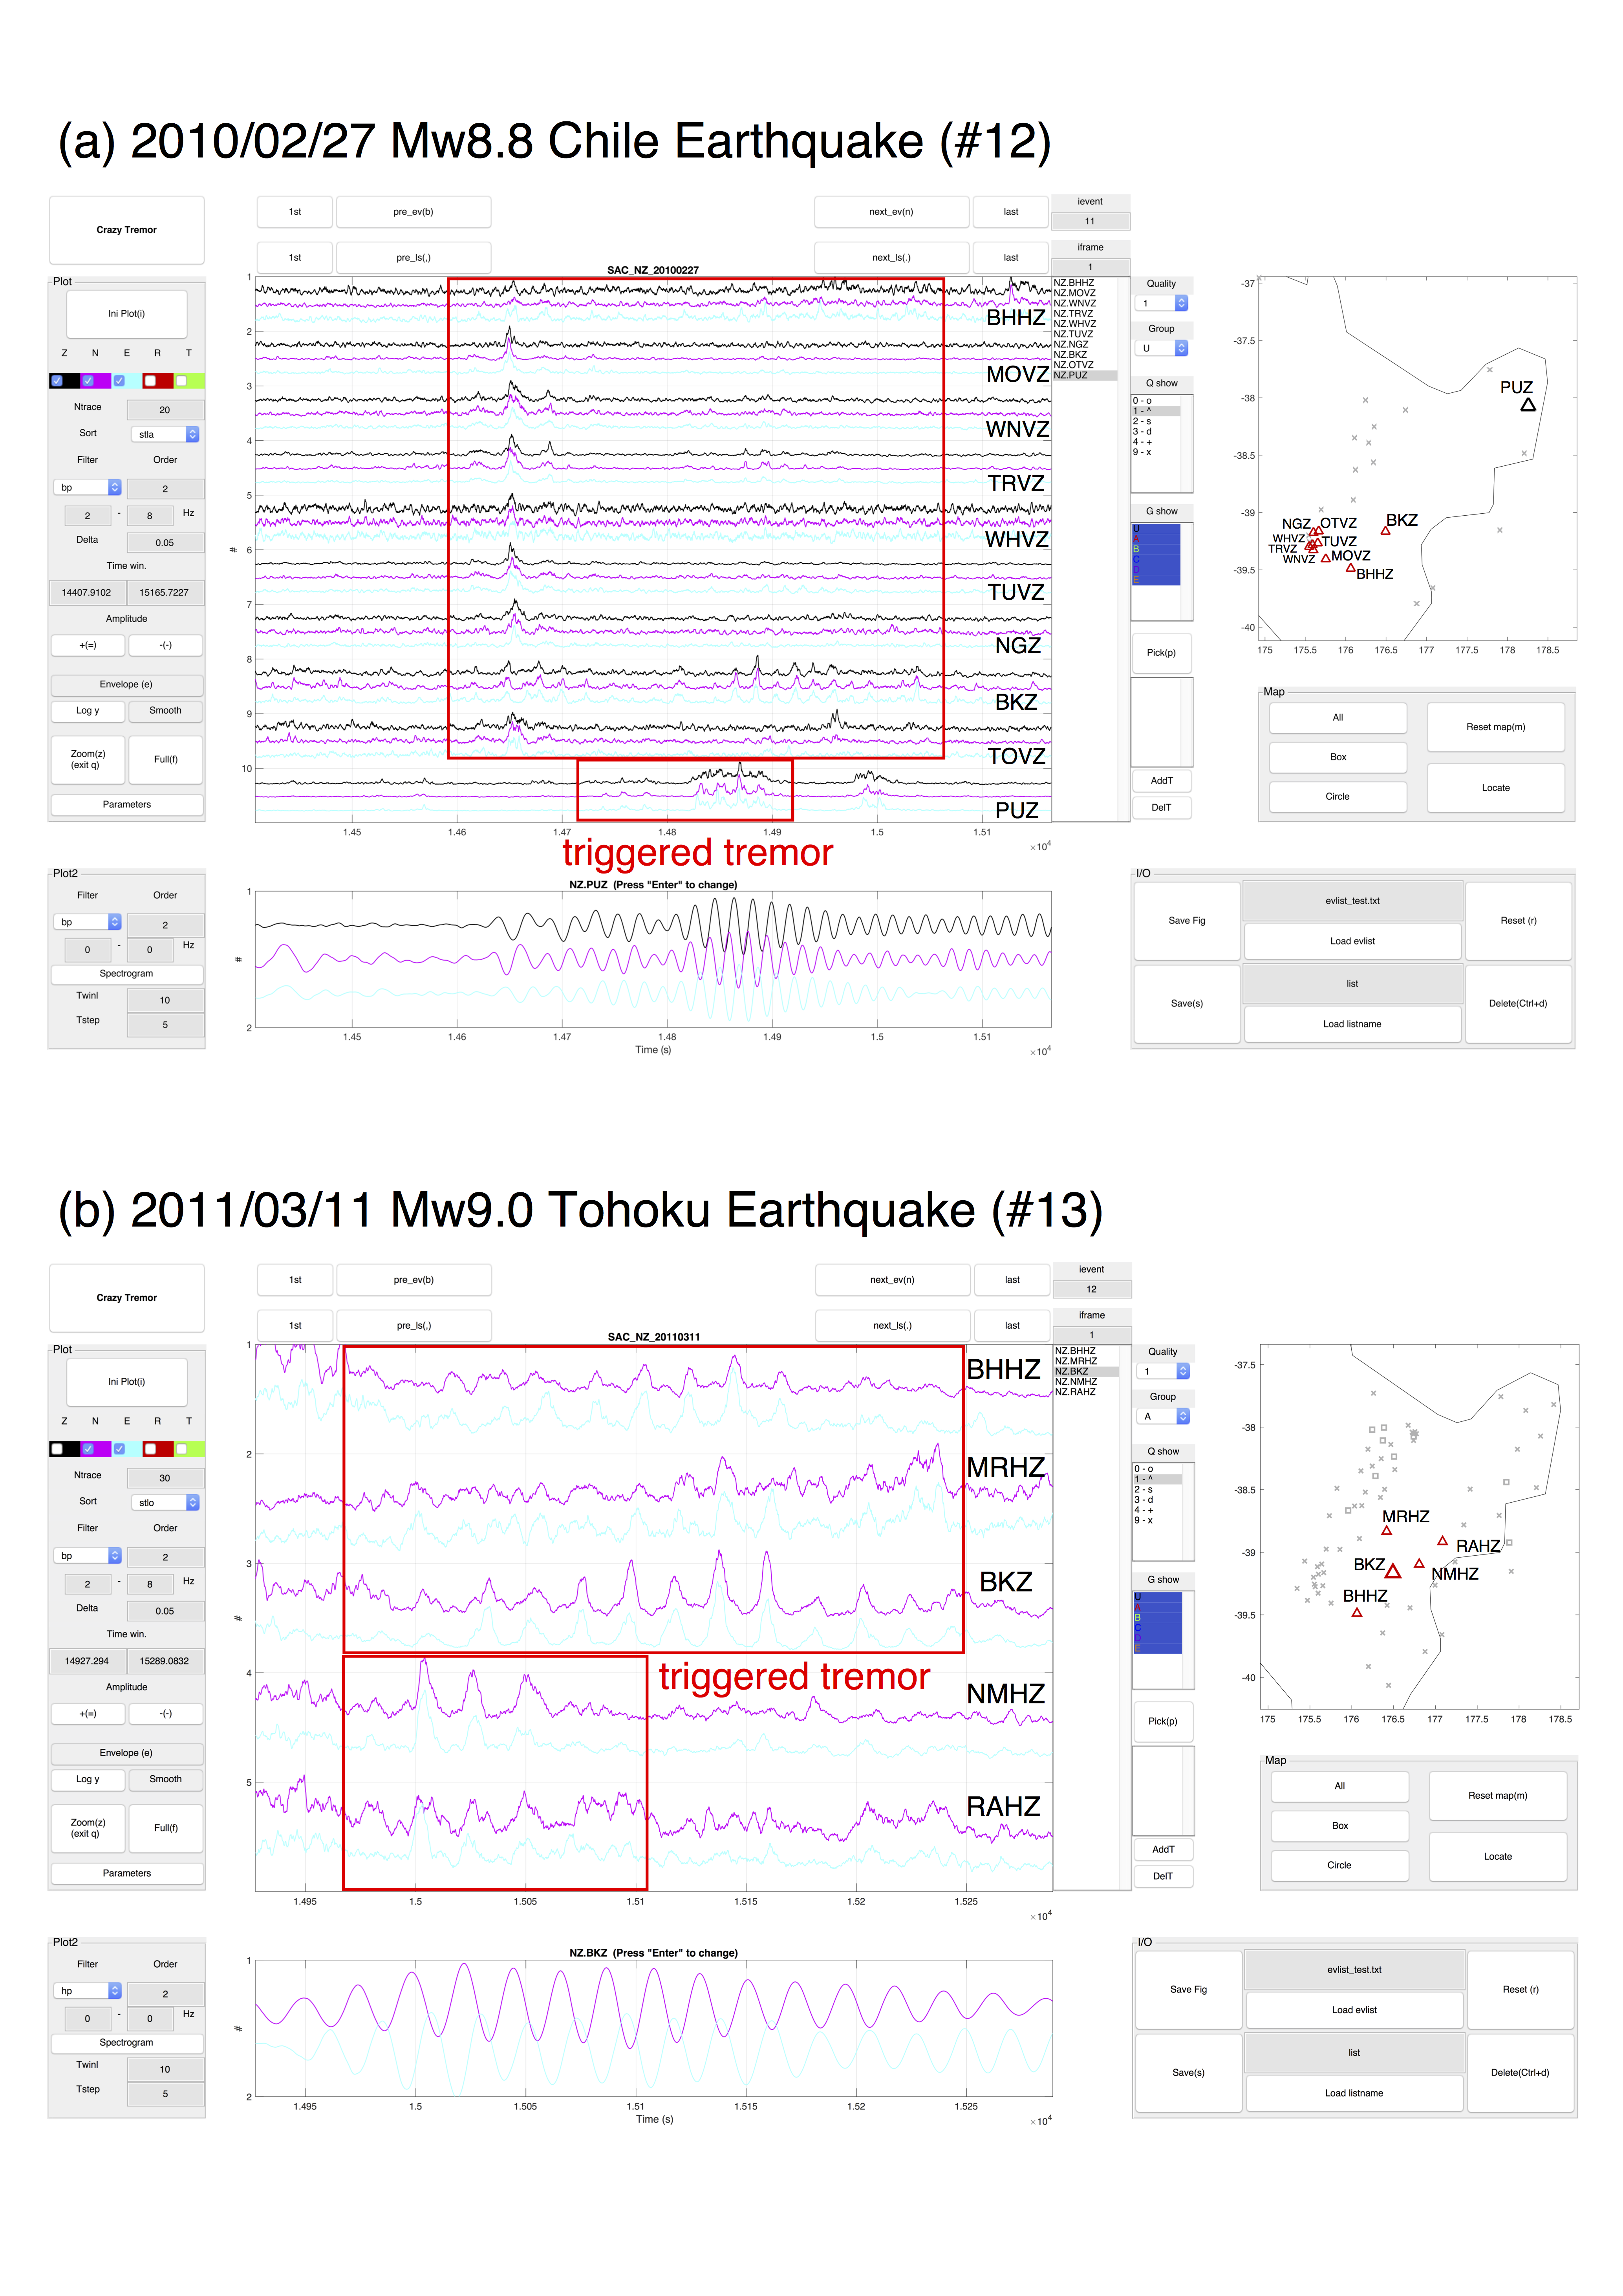
Figure S5. Observations of triggered tremor after (a) the 27 February 2010 Mw 8.8 Chile earthquake and (b) the 11 March 2011 Mw 9.0 Tohoku earthquake. All notations are the same as in Figure S1.
Figure S6. Observations of triggered tremor after the 11 April 2012 Mw 8.6 Sumatra earthquake in (a) the central Hikurangi subduction margin and (b) the northern Hikurangi margin. All notations are the same as in Figure S1.
Figure S7. The observed dynamic stress (y axis) versus the back azimuth (BAZ, x axis) for all 18 teleseismic earthquakes in six regions in (a) region I: central Hikurangi subduction margin; (b) region II: northern Hikurangi subduction margin; (c) region III: Northland in the North Island; (d) region IV: Kaikōura in the South Island; (e) region V: central Alpine fault; and (f) region VI: Southland in the South Island. The dynamic stress is measured from the transverse (red square) and vertical (blue circle) components of the high-broadband station in each area based on the maximum peak ground velocity of Love and Rayleigh waves, respectively. The color symbols represent tremor-triggering earthquakes, and the open symbols indicate non–tremor-triggering earthquakes (Table 1 in the main article and Table S1). The horizontal red solid line and the horizontal blue dashed line mark the minimum apparent tremor-triggering stress in the transverse and vertical components, respectively. The triggering earthquakes include the 23 December 2004 Mw 8.1 earthquake offshore of the South Island (event 1) and the 28 March 2005 Mw 8.6 Nias (event 3), 3 May 2006 Mw 8.0 Tonga (event 4), 12 September 2007 Mw 8.5 Sumatra (event 6), 15 July 2009 Mw 7.8 Fiordland (event 8), 29 September 2009 Mw 8.1 Samoa (event 9), 27 February 2010 Mw 8.8 Chile (event 12), 11 March 2011 Mw 9.0 Tohoku (event 13), and 11 April 2012 Mw 8.6 Sumatra (event 15) earthquakes. Other nontriggering earthquakes include event 2, 26 December 2004 Mw 9.0; event 5, 1 April 2007 Mw 8.1; event 7, 19 March 2009 Mw 7.6; event 10, 7 October 2009 Mw 7.7; event 11, 7 October 2009 Mw 7.8; event 14, 6 July 2011 Mw 7.6; event 16, 6 February 2013 Mw 8.0; event 17, 8 December 2016 Mw 7.8; and event 18, 17 December 2016 Mw 7.9.
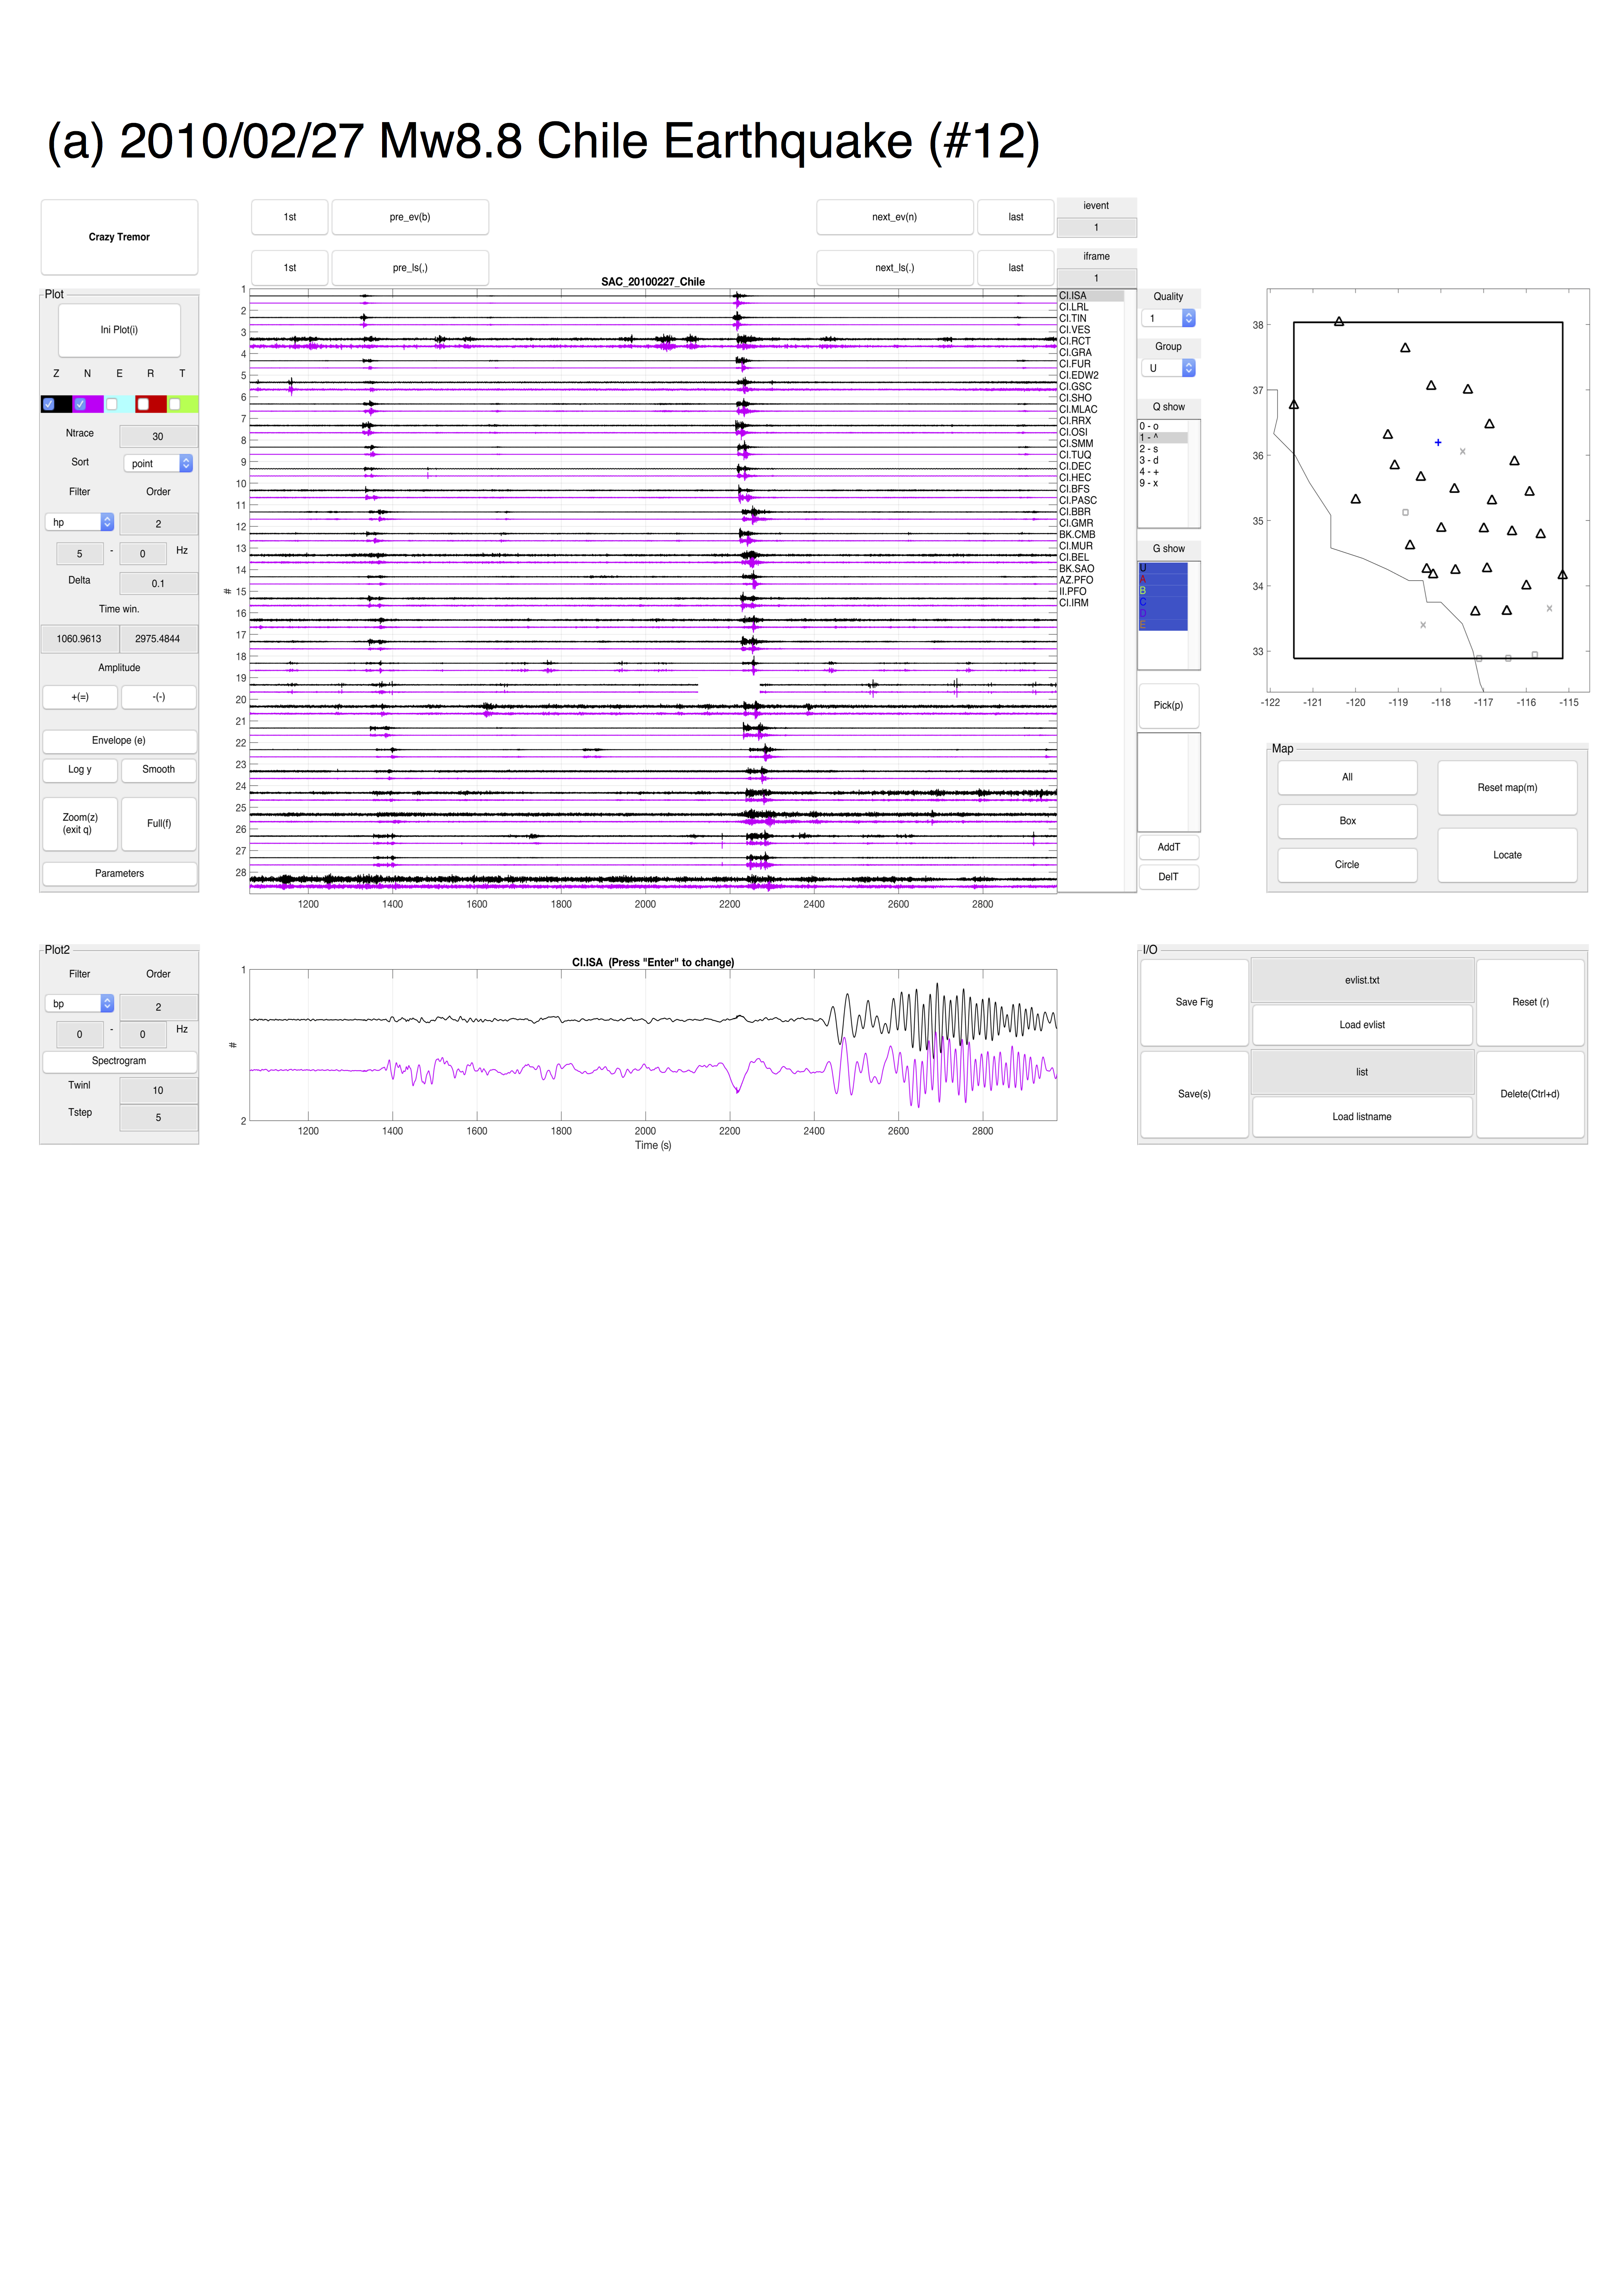
Figure S8. Example of the examination of triggered earthquakes in California with CrazyTremor after the 27 February 2010 Mw 8.8 Chile earthquake. All notations are the same as in Figure S1.
[ Back ]